4 - Imbalances
4.1 - Fair Value Gap (FVG)

4.1.1 - FVG Definition
- Fair Value Gaps (FVG) are most commonly used amongst price action traders and are defined as instances in which there are inefficiencies, or imbalances, in the market. These imbalances simply suggest that buying and selling are not equal.
- Fair Value Gaps are created within a three-candle sequence and are commonly visualized on the chart as a large candle whose neighboring candles’ upper and lower wicks do not fully overlap the large candle.
- Fair Value Gaps remain valid as long as there are no candle body closures beyond their midpoint.
4.1.2 - FVG Types
- Breakaway Gaps: Occur at the start of a new market trend and signify a potential change in market sentiment. Often accompanied by high trading volume, these gaps may not be filled for a long time and indicate a new direction in market movement.
- Continuation Gaps: Known as runaway or measuring gaps, these occur in the middle of a price trend and indicate that the current trend is likely to continue. They validate the current trend's strength.
- Exhaustion Gaps: Appear near the end of a price trend and signal a potential trend reversal. Characterized by low volume, they suggest that the trend is losing momentum.
- Common Gaps: Cannot be categorized into any specific type and are often considered insignificant in market analysis. They usually get filled quickly and are not associated with major news events.
4.1.3 - FVG Trading Opportunities & Market Trends
- Fair Value Gaps can present new trading opportunities especially when coupled with order blocks.
- For the FVG to be considered for a potential entry, it must be in a premium or discount zone with respect to the overall swing movement.
- A narrow or small FVG that is near the order block or supply/demand zone tends to be more suitable for entries than a wide or big FVG.
To effectively confirm the prevailing market trend, one useful indicator is the behavior of Fair Value Gaps (FVG). The manner in which price action interacts with these FVGs can serve as a reliable signpost for the market's direction.
In a bullish market, observe that the price action respects the bullish FVGs, not falling below these gaps, indicating strong bullish sentiment. Conversely, in a bearish market, the price action should respect the bearish FVGs and not rise above them, suggesting dominant bearish sentiment and potential for further decline.
By closely watching how price action aligns with Fair Value Gaps, valuable insights into the market's current mood can be gained, aiding in more informed trading decisions.
4.2 - Volume Imbalance (VI)

- Volume imbalance represents the ratio between the volume generated by buying aggressors (market order transactions on the offer) versus the volume generated by selling aggressors (market order transactions on the bid).
- On the charts, it is found when two candles that are next to each other, overlap only with their wicks.
- Volume Imbalances rarely happen.
- It is probable for the price action to return back and fill up those volume imbalances.
4.3 - Opening Gap (OG)

4.3.1 - Opening Gaps Definition
- Opening gaps occur when a stock's price opens higher than it closed the previous day. There is almost always a catalyst for this, such as overnight news, or company earnings. This could mean that a new trend is about to start or it could be a sign of a reversal.
It is probable for the price action to return back and fill up those gaps.
4.3.2 - New Day Opening Gap (NDOG) & New Week Opening Gap (NWOG)
In trading, NDOG and NWOG are terms used to refer to new day opening gaps and new week opening gaps, respectively. These are gaps that occur when the market opens for the first time on a new day or week, and they can be used as potential support or resistance levels.
Generally speaking, the price tends to revert towards opening gaps under consolidating market conditions. This is because gaps are often created by a large imbalance of buying or selling pressure, and this imbalance can eventually be resolved as price moves back towards the gap.
-
NDOG: A new day opening gap is a gap that occurs when the market opens for the first time on a new day. It is calculated by taking the difference between the previous day's closing price and the first price traded on the new day.
-
NWOG: A new week opening gap is a gap that occurs when the market opens for the first time on a new week. It is calculated by taking the difference between the previous week's closing price and the first price traded on the new week.
Both NDOGs and NWOGs can be used as potential support or resistance levels. However, it is important to note that they are not always reliable, and price may not always respect them.
- Only trade NDOGs and NWOGs in consolidating markets. If the market is trending, it is more likely that price will continue to move in the same direction and ignore the gap.
- Use other technical indicators to confirm that price is likely to respect the NDOG or NWOG. For example, you could look for a confluence of support or resistance levels, or you could wait for a breakout or breakdown from the gap.
- Use stop losses to protect your profits. Even if price respects the NDOG or NWOG, it is possible that it will eventually break through the level. By using a stop loss, you will limit your losses if this happens.
4.4 - Balanced Price Range (BPR)
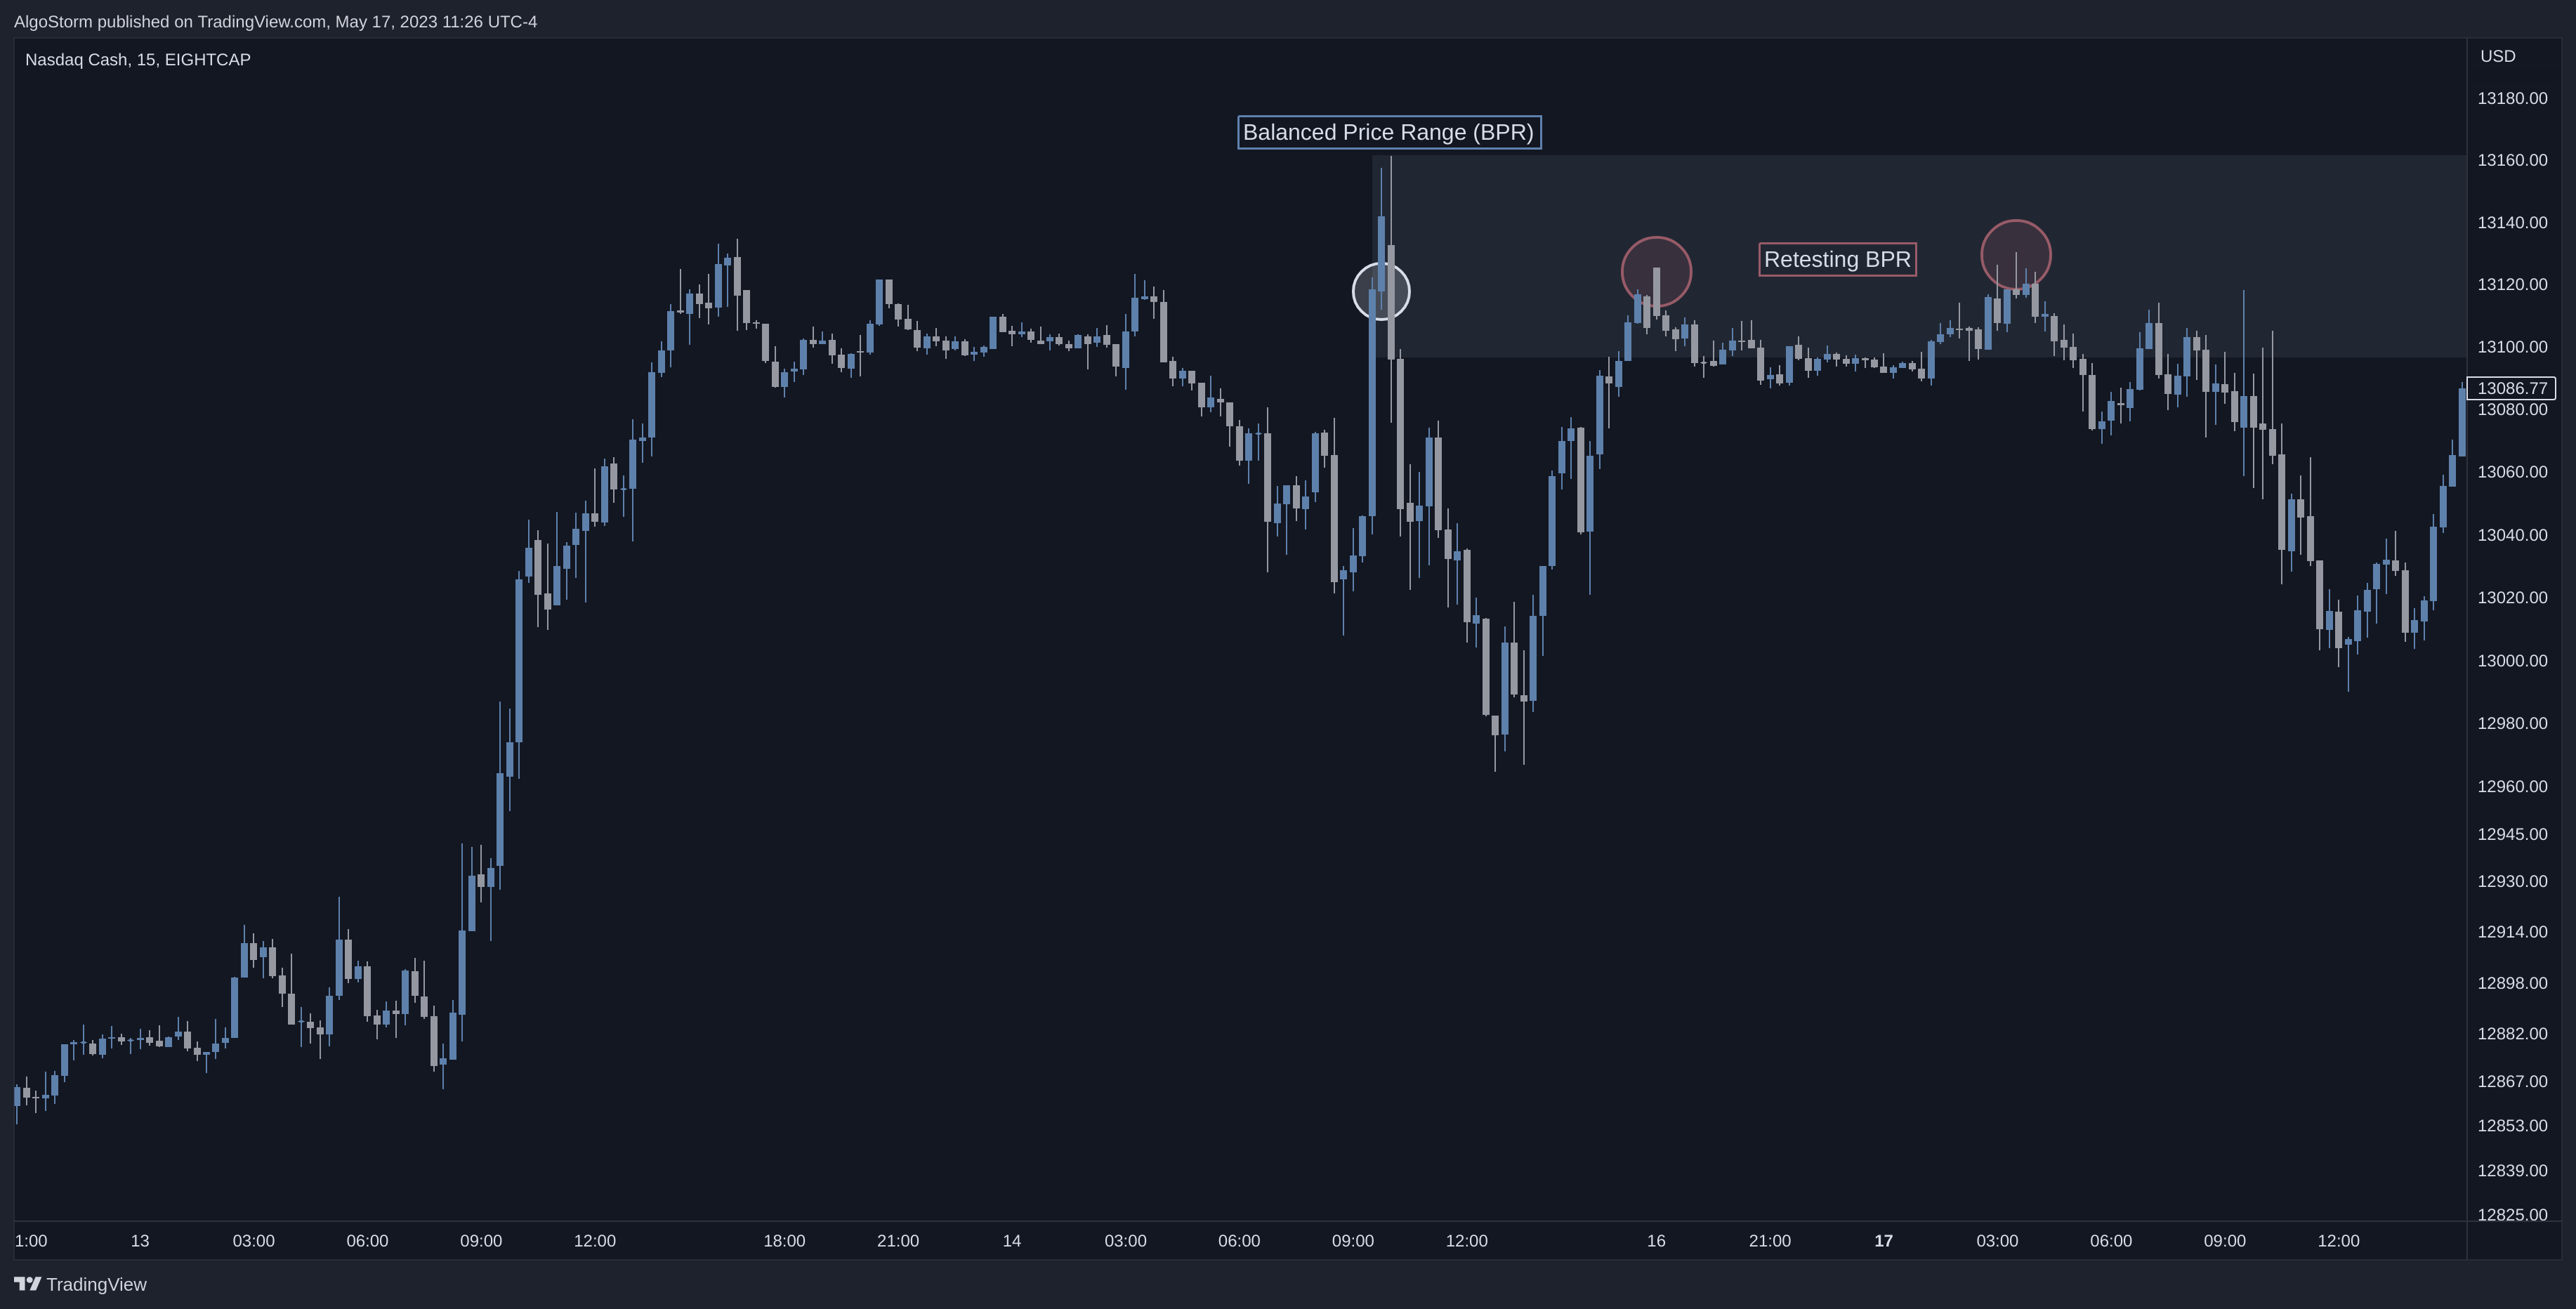
A Balanced Price Range (BPR) is the price interval created by the overlap of a bullish Fair Value Gap (FVG) and a bearish FVG. These opposing gaps form from significant directional displacements (moves) within the same swing. The overlapping segment is interpreted as the area where buy-side and sell-side inefficiencies are partially offset, or "rebalanced."
Key Characteristics of BPR
- Formation: Results from an aggressive move in one direction, creating an FVG, followed by a corrective, aggressive move in the opposite direction, creating a counter FVG. The zone where these two gaps overlap forms the BPR.
- Interpretation: The BPR represents a zone of equilibrium where prior buying and selling pressure (the inefficiencies that created the FVGs) have partially canceled each other out.
- Magnetic Effect: Like other imbalances, the BPR can exert a magnetic effect on the price. Price may revisit this zone, testing the balance before deciding on a further direction.
- Reference Zone for Reactions: The BPR commonly serves as a reference zone for market reactions. It can act as support, resistance, a mitigation area, or a potential entry point, depending on the context and subsequent price action.
- Market Structure Shift: The formation of a BPR can sometimes signal the start of a Market Structure Shift (MSS), as it may indicate a pause or a battle between bulls and bears before a new trend direction is established. Price often retraces and bounces off these areas.
Some traders refer to these zones or ranges as Inverse Fair Value Gaps (IFVG).