9 - Order Blocks Evaluation
9.1 - The Strength Pillars Of Order Blocks
9.1.1 - Pillar #1: Breakout Strength
- Definition: It is the size of the impulsive move that the order block generates.
- Relation: It is directly proportional to the strength of the order block.
- Description: The bigger the displacement of the price action from the order block, the more powerful the order block is.
9.1.2 - Pillar #3: Freshness
- Definition: How much time has passed since the generation of this order block.
- Relation: It is directly proportional to the strength of the order block.
- Description: Recent order blocks are more powerful than old order blocks.
9.1.3 - Pillar #3: Number Of Candles
- Definition: How many candles the order block contains.
- Relation: It is inversely proportional to the strength of the order block.
- Description: The more candles the zone contains, the weaker it is.
9.1.4 - Pillar #4: Number Of Revisits
- Definition: How many times has the price action revisited the order block.
- Relation: It is inversely proportional to the strength of the order block.
- Description: The zone should not be visited more than one time to remain valid.
9.1.5 - Pillar #6: Spikes
- Order blocks that contain spikes (liquidity grabs) are considered powerful.
9.1.6 - Pillar #7: Premium/Discount Areas
- When the demand zone is in the discount area or the supply zone is in the premium area, they are considered powerful.
9.1.7 - Pillar #9: Volume Profile Nodes
- Order blocks that are positioned at the extreme nodes of the volume profile are considered more powerful.
- By plotting the volume profile of the entire session on your chart, you can get the volume activity on the vertical axis showing you the volume per price.
- Mark the extreme nodes of the volume profile; the very high and very low nodes of volume.
- These extreme nodes of the volume profile serve as confluence levels for the order blocks.
9.1.8 - Pillar #9: Pivot Points
Traditional pivot points are a prevalent technical analysis tool used to determine potential support and resistance levels in the financial markets. They are calculated using the high, low, and closing prices of the previous trading day. The basic pivot point (P) is found by averaging the high (H), low (L), and close (C) from the previous day's trading:
P = (H + L + C) / 3
From this pivot point, additional levels of support and resistance are calculated. These levels are often referred to as S1, S2, S3 for support levels, and R1, R2, R3 for resistance levels. They are computed as follows:
First Level Support and Resistance:
R1 = (2 * P) - L
S1 = (2 * P) - H
Second Level Support and Resistance:
R2 = P + (H - L)
S2 = P - (H - L)
Third Level Support and Resistance:
R3 = H + 2 * (P - L)
S3 = L - 2 * (H - P)
Traders often view these pivot levels as significant because they are derived from the actual price data of the previous day, which reflects the collective market psychology.
When order blocks—large clusters of buy or sell orders—are aligned with these pivot points, they are generally considered to have a greater potential impact on price movements. This is because the confluence of the order blocks with calculated pivot levels provides a compounded area of interest for traders, which could lead to increased market reactions at these points. As such, a trader might find a stronger case for entering or exiting a position when these two factors coincide.
All popular charting programs offer pivot points as an indicator that you can add to your chart.
9.2 - Order Blocks Evaluation Notes
- Only valid order blocks are subject to evaluations. Check the previous chapter to learn more about the validity of order blocks.
- You need to evaluate the zones and give one point to every pillar listed below. The more points the zone has, the more likely the price action would bounce from it in its next visit.
- When order blocks are closely stacked, only the farthest one is considered strong.
- If a new order block appears above/below an unvisited/unmitigated order block, it is considered a weak zone compared to the one that was left unvisited.
9.3 - Front-Running & Liquidity Hunting
- Front-Running : When the order block is fresh and very strong, the price action might bounce off without touching the zone.
- Liquidity Hunting : When the order block is not fresh or strong, the price action might wick or go beyond the zone to hunt for new orders before any potential reversal.
9.4 - Order Blocks (OB) & Fair Value Gaps (FVG)
-
Analyzing the market flow and structure is key in knowing whether the current market is reacting off fair value gaps or order blocks.
-
We usually consider fair value gaps for entries when the market flow is being controlled by algorithms. We can detect that by spotting clear liquidity grabs. On the other hand, we may consider order blocks for entries when the market flow is controlled by institutions or banks. Normally this happens, when there are not much of sharp liquidity grabs.
-
There are times when it is not clear whether to take order blocks or fair value gaps as entries. At such times, it would depend on your trading style. If you are a conservative trader, consider order blocks in such a case. If you are an aggressive trader, consider fair value gaps but widen your stop loss to include the order block as long as your risk-to-reward ratio (R:R) is at least (1:2). If the risk-to-reward ratio of your trade is not optimal or if the trade idea is not clear, do not take it. Missing a winning trade is always better than losing one.
9.5 - Inducement Blocks
9.5.1 - Inducement Blocks vs Order Blocks
An inducement block is a zone where smart money investors may try to induce other market participants to take a particular action, such as buying or selling a stock, by offering an incentive or by manipulating the market in some way. inducement blocks often occur around key support or resistance levels, and they tend to be short-lived.
On the other hand, a valid order block is a level where there is a significant imbalance of supply and demand, leading to a high probability of price reversal. Order blocks tend to occur after a strong move in price, and they often act as reversal or continuation zones. They are typically marked by a series of bars with a distinct market structure, such as a strong move followed by a period of consolidation.
To differentiate between an inducement block and an order block, it's important to consider the context and behavior of price around the level. inducement blocks may have sudden and sharp moves in price, while valid order blocks tend to have a more gradual and controlled price movement. Order blocks may also have a more structured and identifiable price pattern than inducement blocks. Additionally, it's important to consider the volume and liquidity around the level, as order blocks tend to have higher volume and liquidity than inducement blocks.
Overall, distinguishing between an inducement block and a valid order block requires careful analysis of the price action, volume, and liquidity around the level, as well as an understanding of the market context and the behavior of smart money investors.
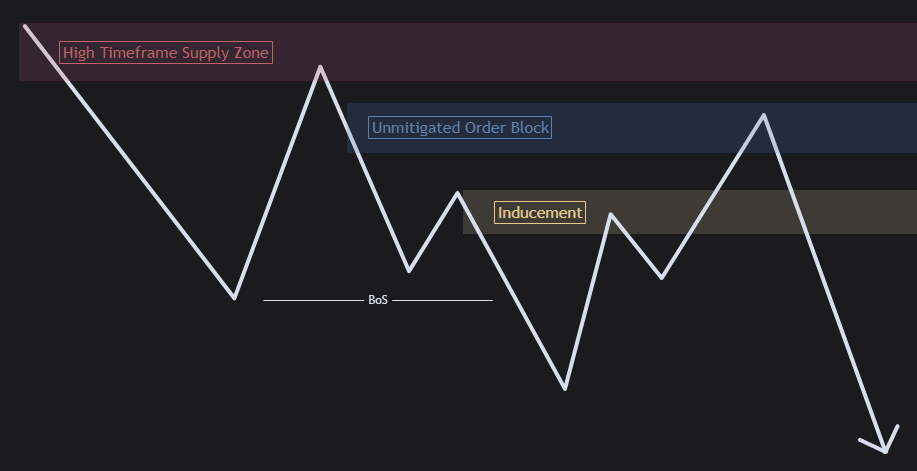
9.5.2 - Inducement Blocks In Uptrends & Downtrends
- In Uptrends: It happens above an unmitigated order block.
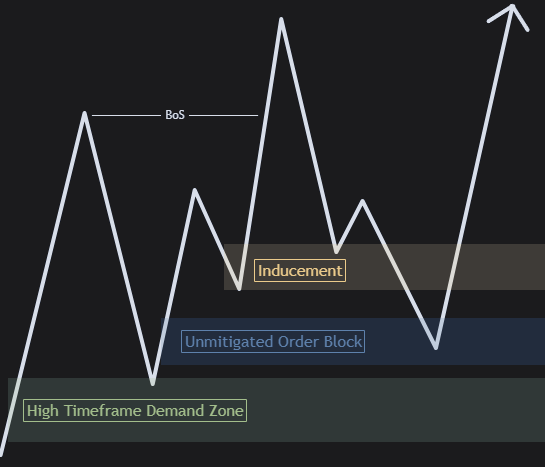
- In Downtrends: It happens below an unmitigated order block.