1 - Market Structure
1.1 - Market States

| Trend | State | Behavior | Description |
|---|---|---|---|
| Uptrend | Unbalanced | Bullish | Price action is making higher highs and higher lows. |
| Downtrend | Unbalanced | Bearish | Price action is making lower lows and lower highs. |
| Sideways | Balanced | Ranging | Price action is moving within a clear range without breaking major swing points. |
1.2 - Market Waves
Uptrends & downtrends are made up of 2 key components:
- Impulses.
- Corrections.
We can view the impulses & corrections as swing structure & sub-structure. The overall direction of the larger trend is the swing structure and the pullback move happening within each correction is a smaller trend itself, named sub-structure.
- You might also be interested to read about the Elliot Waves which describes a system for reading the market waves.
1.3 - Swing Points & Market Structure
In trading, understanding the concepts of swing points and market structure is vital for analyzing price movements, determining trend strength, and predicting potential reversals or continuations. These concepts are foundational in technical analysis and essential for strategic decision-making in trading.
1.3.1 - Swing Points
Swing points, often visualized on price charts, are significant levels where the price direction changes, marked by peaks and troughs in an asset's price movements.
-
Swing High: A swing high occurs when the price reaches a peak before declining. It can be identified when a candlestick's high is greater than the highs of at least the two preceding and two following candlesticks, encompassing a total of five candles. This pattern indicates a potential resistance level where selling pressure overcomes buying pressure.
-
Swing Low: Conversely, a swing low occurs when the price dips to a trough before ascending. It is recognized when a candlestick's low is beneath the lows of at least the two preceding and two following candlesticks, also within a total of five candles. This pattern signals a potential support level where buying pressure overcomes selling pressure.
Finding swing highs and lows can be tricky, especially when deciding how many candles to look at around the point where the price might change direction. Many traders start by looking at two candles on each side of this point (making five candles in total), but this number can change depending on how quickly the market is moving.
In fast-moving markets with shorter timeframes, it's a good idea to look at more candles. This helps tell the difference between real trends and random price movements. In slower markets with longer timeframes, price changes are clearer, and you might not need to look at as many candles — but it's always good to look at at least two on each side to be sure.
Here's a helpful guide for how many candles to consider based on different timeframes:
| Timeframe | Suggested Candles On Each Side |
|---|---|
| 1-minute to 5minute | 8+ Candles |
| 5-minute to 30-minute | 6+ Candles |
| 1-hour to 4-hour | 4+ Candles |
| 12-hour to Weekly | 2+ Candles |
Keep in mind, these numbers aren't strict rules. They're just a starting point to help you make trading decisions. Successful trading means learning all the time and adjusting your strategies to fit the current market situation and your own trading style.
With the AlgoStorm Market Compass (AMC) indicator, you have the option to activate the "Fractals" feature, allowing you to designate the specific number of candles you'd like the indicator to evaluate. This automated analysis aids in identifying the price action structure, tailored to your unique trading strategy. It's important to understand that the indicator requires X periods to accurately render the fractals, where X represents the number of candles you've predetermined in the settings. This interval is crucial for the tool to comprehensively analyze and depict the relevant market trends for you.
1.3.2 - Bullish Market Structure
In a bullish market structure, the price of an asset is in an overall uptrend, characterized by upward price movements. Key components include:
-
Higher Highs (HH): This occurs when the peak of a new swing high surpasses the peak of the previous swing high, indicating increasing bullish momentum and buyer dominance in the market.
-
Higher Lows (HL): This is when the trough of a new swing low is higher than the trough of the previous swing low, suggesting that buyers are stepping in at higher levels and that the uptrend is sustained through continued buying interest.
Consistently observing HH and HL patterns is indicative of a strong bullish market structure, signaling opportunities for long positions.
1.3.3 - Bearish Market Structure
In a bearish market structure, the price is in an overall downtrend, characterized by downward price movements. Essential elements include:
-
Lower Highs (LH): This happens when the peak of a new swing high is lower than the peak of the previous swing high, reflecting increasing bearish momentum and seller dominance in the market.
-
Lower Lows (LL): This occurs when the trough of a new swing low is deeper than the trough of the previous swing low, indicating that sellers are driving prices down further and that the downtrend is persistent due to continued selling interest.
Persistent LH and LL patterns signify a robust bearish market structure, presenting opportunities for short positions.
1.4 - Market Cycles
The best way to describe the market cycles is by studying the Wychoff method.
The Wyckoff method is a technical analysis approach developed by Richard Wyckoff, a stock trader and market analyst, in the early 20th century. The method is designed to help traders and investors identify potential trading opportunities by analyzing the supply and demand dynamics of the market.
The Wyckoff method is based on the principle that the market is driven by the forces of supply and demand, and that changes in the balance of supply and demand can be used to anticipate future price movements. The method is focused on identifying accumulation and distribution phases in the market, which occur when smart money is buying or selling large positions in anticipation of future price movements.
The Wyckoff method identifies four key stages of the market cycle: accumulation, markup, distribution, and markdown.

1.4.1 - Wyckoff Principles & Foundation
The principles and foundation of the Wyckoff method include:
-
Supply and demand: The Wyckoff method is based on the principle that the market is driven by the forces of supply and demand. The method aims to identify changes in the balance of supply and demand to anticipate future price movements.
-
Accumulation and distribution: The Wyckoff method identifies accumulation and distribution phases in the market, which occur when smart money is buying or selling large positions in anticipation of future price movements.
-
Market cycles: The Wyckoff method recognizes that the market moves in cycles of accumulation, markup, distribution, and markdown. These cycles represent the phases of accumulation and distribution and help traders to identify potential turning points in the market.
-
Price and volume analysis: The Wyckoff method uses price and volume analysis to identify potential support and resistance levels, as well as to determine the strength or weakness of buying and selling pressure.
-
Trend analysis: The Wyckoff method focuses on identifying trends in the market and understanding how they are formed and how they evolve over time. Trend analysis helps traders to anticipate potential price movements and to identify potential trading opportunities.
Overall, the Wyckoff method is based on the idea that the market is a reflection of the underlying supply and demand dynamics, and that by understanding these dynamics, traders can anticipate future price movements and make informed trading decisions.
1.4.2 - Common Wyckoff Patterns
-
Accumulation: The Accumulation pattern is the first stage of the Wyckoff Method, where large institutions are accumulating assets before a market move. In this pattern, prices move in a sideways range, forming a base. Volume is often low during this phase. Once the accumulation phase is complete, prices typically break out of the range and start to rise.
-
Markup: The Markup pattern is the second stage of the Wyckoff Method, where prices are in an uptrend. In this pattern, prices tend to rise in a series of higher highs and higher lows, with volume increasing as the trend progresses. The goal during the Markup phase is to enter long positions and ride the trend higher.
-
Distribution: The Distribution pattern is the third stage of the Wyckoff Method, where large institutions are distributing assets before a market move. In this pattern, prices move in a sideways range, forming a top. Volume is often low during this phase. Once the distribution phase is complete, prices typically break down from the range and start to fall.
-
Markdown: The Markdown pattern is the fourth and final stage of the Wyckoff Method, where prices are in a downtrend. In this pattern, prices tend to fall in a series of lower highs and lower lows, with volume increasing as the trend progresses. The goal during the Markdown phase is to enter short positions and ride the trend lower.
-
Spring: The Spring pattern is a common Wyckoff pattern that occurs during the Accumulation phase. In this pattern, prices briefly break below a key support level, triggering stop-loss orders and causing panic selling. However, once the panic selling subsides, prices quickly rebound, creating a buying opportunity.
-
Upthrust: The Upthrust pattern is a common Wyckoff pattern that occurs during the Distribution phase. In this pattern, prices briefly break above a key resistance level, triggering stop-loss orders and causing a short-term uptrend. However, once the short-term uptrend subsides, prices quickly fall back below the resistance level, creating a selling opportunity.
1.4.3 - Other Wychoff Patterns
-
Sign of Strength (SOS): The Sign of Strength pattern occurs during the Markup phase when a stock experiences a sharp, sudden increase in price on high volume. This indicates strong demand and can signal the beginning of a new trend.
-
Sign of Weakness (SOW): The Sign of Weakness pattern occurs during the Distribution phase when a stock experiences a sharp, sudden drop in price on high volume. This indicates strong selling pressure and can signal the end of a trend.
-
Shakeout: The Shakeout pattern is similar to the Spring pattern but is more aggressive. In this pattern, prices briefly break below a key support level, triggering stop-loss orders and causing panic selling. However, prices continue to drop even lower, shaking out weaker traders, before rebounding higher.
-
Test: The Test pattern occurs when prices retest a previous support or resistance level after breaking out of a consolidation phase. If prices hold above the support level or break through the resistance level on increased volume, this can confirm the validity of the breakout.
-
Last Point of Supply (LPS): The Last Point of Supply pattern occurs during the Distribution phase when prices briefly rally back to a key resistance level before turning lower. This indicates that large institutions are still selling and can signal the end of the trend.
It's worth noting that these patterns can occur in different combinations and sequences, and their interpretation can depend on the broader market context and the trader's individual approach. Therefore, it's important to study these patterns in depth and use them as part of a comprehensive trading strategy.
Overall, the Wyckoff patterns are a useful tool for identifying potential trading opportunities based on market structure and volume. By understanding these patterns, traders can better anticipate market movements and make more informed trading decisions.
1.4.4 - Wychoff Laws
The Wyckoff Laws are a set of principles that Richard Wyckoff developed to help traders better understand and interpret price action in the market. The laws are based on the idea that the market is made up of the actions of large institutions, and that by understanding these actions, traders can gain an edge in their trading.
-
Law of Supply and Demand: The Law of Supply and Demand states that prices will move based on the supply and demand for a particular asset. If there is more demand for an asset than there is supply, prices will rise. If there is more supply than demand, prices will fall.
-
Law of Cause and Effect: The Law of Cause and Effect states that every action in the market creates a reaction. This means that changes in supply and demand, as well as other factors that affect the market, will create a chain reaction of price movements.
-
Law of Effort vs. Result: The Law of Effort vs. Result states that the effort put into a move in the market should be proportional to the result achieved. For example, if a stock experiences a significant increase in price on high volume, this indicates that there was a lot of effort put into buying the stock, and the result was a significant price increase.
These laws are not specific trading strategies, but rather a framework for understanding market dynamics and making informed trading decisions. By applying these principles to their analysis of price action, traders can identify key levels of supply and demand, recognize trends, and make more accurate predictions about future price movements.
- Market cycles take both fundamental and technical indicators (charting) into account, using securities prices and other metrics as a gauge of cyclical behavior.
- The "Power Of Three" also called ("AMD") by some references is a trading term that refers to the three stages of Accumulation, Manipulation, and Distribution.
- You can read more about the Wyckoff Method on the Wyckoff Analytics website.
1.5 - Market Phases

1.5.1 - Contraction Phase
The contraction phase happens when there is low institutional volume. It can be seen as the price action squeezes and gets smaller into sideways movement with very low volatility. Institutions and banks use this phase for slow accumulation or distribution in stages depending on the market cycle and their plans.
1.5.2 - Expansion Phase
The expansion phase happens after the contraction phase. It comes with an increase in institutional volume. The price starts opening up taking out highs and lows while grabbing liquidity. This is usually where the smart money accumulates/distributes positions at great prices.
1.5.3 - Trending Phase
The trending phase happens after the expansion phase and it is the profit-taking phase for institutions, banks, and smart money. The market makes its move to higher or lower prices.
1.6 - Market Direction
- Determine the overall market trend or direction by checking the structure of the major pivots.
- If the pivots are making higher highs and higher lows, then we can assume that we are in a bullish trend.
- If the pivots are making lower lows and lower highs, then we can assume that we are in a bearish trend.
- If the price action is moving between two levels, then we are in a ranging market.
For clarity in understanding market structure, especially for beginners:
- Before designating a point as a higher low in a potential uptrend, ensure that the subsequent high exceeds the previous high.
- Before designating a point as a lower high in a potential downtrend, ensure that the subsequent low falls below the previous low.
Adhering to this method offers a systematic approach to trend analysis, minimizing premature decisions based on incomplete trend formations.
1.7 - General Daily Bias
1.7.1 - Bullish Daily Bias
A Bullish Daily Bias is generally identified in one of the following scenarios:
-
Above Previous Close: When the closing price of the most recent daily candle is higher than the closing price of its preceding daily candle. A higher close relative to the previous day often indicates strong upward momentum. This is a typical signal used by traders to consider entering long positions after a pullback ideally below the current daily open.
-
Failed Bearish Close: When the price action for the day initially moves downwards but fails to close below the low of the previous bearish candle. This indicates that the bears have failed to take control of the market, and could be a sign that the bulls are ready to take over.
1.7.2 - Bearish Daily Bias
A Bearish Daily Bias is generally indicated in one of the following conditions:
-
Below Previous Close: When the closing price of the most recent daily candle is lower than the closing price of its preceding daily candle. A lower close relative to the previous day often indicates strong downward momentum. This is a typical signal that traders might use to consider entering short positions after a pullback ideally above the current daily open.
-
Failed Bullish Close: When the price action for the day initially moves upwards but fails to close above the high of the previous bullish candle. This suggests that the bulls have failed to keep control, possibly indicating a shift in power towards the bears.
1.7.3 - Neutral Daily Bias
A Neutral Daily Bias typically occurs in the following scenarios:
-
Doji Formation: When the daily candle forms a Doji, which means the opening and closing prices are virtually the same. A Doji usually represents indecision in the market. Neither the bulls nor the bears are able to gain control, often signaling a potential change in direction or a continuation of a range-bound market.
-
Within Previous Range: When the entire price action of the daily candle remains within the high and low range of the previous day's candle. This indicates that the market is consolidating, and traders are awaiting further signals before taking a directional bias.
-
For Investors: Investors, who typically have a long-term perspective, can benefit most from considering the Monthly and Weekly Bias. These longer timeframes offer insights into overarching trends and can be less sensitive to short-term market noise. Longer timeframes tend to filter out the 'noise' of short-term fluctuations, offering a clearer view of the market's direction over extended periods. This aligns well with an investor's long-term strategy.
-
For Swing Traders: Swing Traders, who aim to capitalize on short- to medium-term price movements, will find the Daily Bias particularly useful. This timeframe balances the need for actionable data with a broad enough perspective to identify meaningful patterns. The daily timeframe provides a middle-ground approach, offering enough data points for trend identification without being overly influenced by intra-day volatility. This aligns with a swing trader's need to hold positions for several days to weeks.
-
For Day Traders: Day Traders, who typically open and close positions within a single trading day, should focus on the 4-Hour Bias. This timeframe is granular enough to provide multiple trading opportunities within a day, yet long enough to capture larger price movements. The 4-hour bias offers a detailed enough view for entering and exiting positions within the span of a single day. It's sufficiently long to avoid the noise of very short-term fluctuations, making it well-suited for day trading.
-
For Scalpers: Scalpers, who aim to profit from very short-term price changes, are best served by the Hourly Bias. This timeframe is highly responsive to immediate market conditions, offering a plethora of opportunities for quick trades. The hourly bias provides the level of detail required for rapid decision-making and quick execution of trades. It's ideal for those looking to capitalize on minute-to-minute fluctuations in price.
1.8 - SPH & SPL


- Structural Point (SP): It is a turning point from which a move that breaks a high or low is generated.
- When the generated move from a turning point breaks a high, we call that point: Structural Point Low (SPL).
- When the generated move from a turning point breaks a low, we call that point: Structural Point High (SPH).
1.9 - Introduction To FVG

-
Fair Value Gaps (FVG) are most commonly used amongst price action traders and are defined as instances in which there are inefficiencies, or imbalances, in the market. These ‘imbalances’ simply suggest that buying and selling are not equal.
-
Fair Value Gaps (FVG) are created within a three-candle sequence and are commonly visualized on the chart as a large candle whose neighboring candles’ upper and lower wicks do not fully overlap the large candle.
1.10 - HFI & LFI
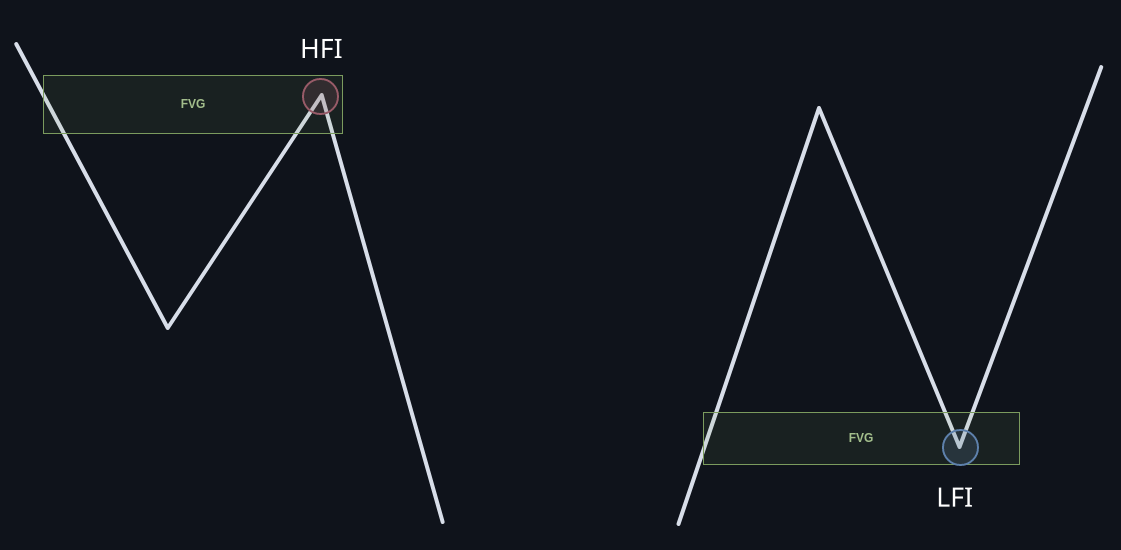
- Swing High From Imbalance (HFI): This is a swing high that forms after filling an imbalance or a Fair Value Gap (FVG).
- Swing Low From Imbalance (LFI): This is a swing low that forms after filling an imbalance or a Fair Value Gap (FVG).
When an HFI or LFI is breached, it's an early indication that the trend may be weakening, suggesting a probable reversal.
1.11 - BOS & CHoCH


1.11.1 - Break Of Structure (BOS)
- Break of Structure (BOS): Occurs in trend continuation scenarios when the price action breaks a previous higher high (in an uptrend) or a lower low (in a downtrend).
- Break of Structure Plus (BOS+): This is a specialized variant of the Break of Structure (BOS) concept that incorporates a Fair Value Gap (FVG) within the price leg responsible for breaking the established market structure. It is considered a strong break of structure.
For any break of structure (BOS/BOS+), it's advisable to wait for the candle body to close before confirming the break. Disregard wicks that breach the structure, as they often result in lower-probability trading opportunities.
1.11.2 - Change of Character (CHoCH)
- Change of Character (CHoCH): Occurs in potential trend reversal scenarios when the price action breaks a Structural Point Low (SPL) in an uptrend or Structural Point High (SPH) in a downtrend.
- Change of Character Plus (CHoCH+): This is a specialized variant of the Change of Character (CHoCH) concept that incorporates a Fair Value Gap (FVG) within the price leg responsible for breaking the established market structure. It is considered a strong change of character or market structure shift.
- It's crucial to understand that any change of character (CHoCH/CHoCH+) to be valid, it must happen after the price action interacts with a significant level. This implies that not every price break signifies a change in market character.
- For any change of character (CHoCH/CHoCH+), it's advisable to wait for the candle body to close before confirming the break. Disregard wicks that breach the structure, as they often result in lower-probability trading opportunities.
1.11.3 - Table & Notes
| Feature | CHoCH / CHoCH+ | BOS / BOS+ |
|---|---|---|
| Trend direction | Reverses | Continues |
| Support or resistance level | Broken in the direction opposite of the current trend | Broken in the direction of the current trend |
| Usually Preceded by | Period of consolidation | Period of momentum |
| Trading implications | Look for a reversal trade | Look for a continuation trade |
- Market Structure Shift (MSS) is another name for the Change of Character (CHoCH).
- Market Structure Shift Plus (MSS+) is another name for the Change of Character Plus (CHoCH+).
- Pay close attention when price action breaches a Fair Value Gap (FVG) in a direction opposite to the prevailing market trend. This specific event is considered a critical early indicator of a forthcoming Market Structure Shift (MSS). Breaking an FVG against the direction of the current trend is a significant occurrence because it suggests that the established consensus on asset value may be changing. This disruption could indicate that market participants are starting to reevaluate their positions, thereby setting the stage for a potential shift in the overall market structure. Understanding this early sign can be invaluable for traders, as it allows for proactive adjustments to trading strategies. Whether it means tightening stop-losses, reconsidering open positions, or preparing for new entry points aligned with the impending shift, recognizing an FVG break as a precursor to an MSS can provide a critical edge in the market. By being attuned to such pivotal moments where an FVG is broken in the opposite direction of the trend, traders can better anticipate and prepare for shifts in market dynamics.
1.12 - Change in State Delivery (CISD)
The Change in State Delivery (CISD) essentially occurs when an engulfing candlestick pattern forms immediately after the price touches a significant key level or zone. This pattern, characterized by a candlestick that completely overshadows the range of the previous one in size, signals a strong momentum shift in the market. It is particularly noteworthy when observed on timeframes of 15 minutes or above, serving as an early indicator of a potential pullback or trend reversal.
1.13 - Fractal Market
-
The concept of a fractal market suggests that within the intricate tapestry of financial markets, we can discern self-similar patterns and behaviors that repeat across various timeframes. Just as fractal geometry reveals recurring shapes at different scales, traders and analysts observe resemblances in price patterns and trends, whether examining minute-by-minute charts or monthly ones.
-
This fractal nature implies that insights gleaned from shorter timeframes can provide clues about broader market movements, and vice versa. Recognizing market fractality empowers traders to tailor their strategies to different time horizons, enhancing their ability to make informed decisions and navigate the ever-shifting currents of the financial world.
1.14 - Internal & External Market Structure
- External Market Structure: It represents the structural points (SP) that define the market.
- Internal Market Structure: It represents the candlestick structures and formations that occur within the price range defined by the external structure points.
The market structure observed in a shorter timeframe constitutes an integral part of the broader market structure of a subsequent, longer timeframe. In other words, the "internal market structure," referring to the detailed trends and patterns within a specific timeframe, collectively contributes to what can be recognized as the "external market structure" of a longer timeframe. This external structure is an aggregation of various internal market movements, indicating that the micro-level changes observed in shorter periods are, in fact, fundamental components that influence and shape the macro-level market dynamics when analyzed over an extended period.
1.15 - Trend Validation
To potentially confirm a trend, we require four significant structure points (SP) or two consecutive price swings in the same direction. Essentially, identifying two breaks in the same direction enhances confidence in the existence of a trend. Conversely, for a trend change, two breaks in structure in the opposite direction should be observed. This pattern of a double break can indicate a potential trend reversal.
More specifically, a trend change can be identified either by two Market Structure Shifts (MSS/MSS+) or through a sequence of a Change of Character (CHoCH/CHoCH+) followed by a Break of Structure (BOS/BOS+).